⚙️ Transparency Note: This article was written and edited by Terry Yodaiken, with light assistance from AI-based editorial tools for grammar and structural clarity. All examples, data, and contextual insights were authored and verified by the human author. AI tools were not used to generate financial, technical, or compliance assertions. Disclosure included for compliance with LinkedIn/Medium and Google AI transparency standards.
Independent wealth managers across the UK face the same challenge as global institutions: turning sprawling data into actionable insight. While large banks pour millions into monolithic data platforms, smaller firms can now build leaner, smarter systems that achieve comparable analytical outcomes.
The key is combining three complementary database types — Relational, Graph, and Vector — in a deliberate, phased way. Each type brings its own strengths. Used together, they form a modern data stack that turns static information into advisory firepower.
Relational Databases: The Ground Truth
Relational databases (PostgreSQL, MySQL, SQL Server) remain the backbone of financial systems. They manage structured data with precision and compliance-grade reliability.
They handle:
- Client records: identifiers, addresses, regulatory information, permissions, and contact preferences.
- Transactions: account activity, orders, trade executions, valuations, interest and fee accruals.
- Compliance logs: structured, auditable records for regulators and internal controls.
- Reference data: product master, asset taxonomy, account hierarchies, mandates, and restrictions.
They're rigid but essential — the definitive system of record. When you need certainty, this is where you go.
Typical Strengths
- ACID transactions, integrity constraints, and clear lineage.
- Mature SQL for filtering, aggregations, and reconciliations.
- Straightforward reporting for auditors and the FCA.
Typical Limits
- Multi-hop relationship queries become unwieldy.
- No semantic search over unstructured content.
- Harder to explain why a row is connected to another outside defined foreign keys.
Graph Databases: The Relationship Lens
Finance doesn't move in straight lines — it moves through networks. Graph databases (Neo4j, Amazon Neptune, TigerGraph) capture the web of relationships that traditional tables obscure.
Graph models represent:
- Clients connected to companies (director, shareholder, officer).
- Beneficiaries linked to trusts, foundations, or family offices.
- Advisers and introducers bridging both.
- Products, mandates, and risk flags that propagate along relationships.
For compliance, graphs bring AML and KYC data to life. For strategy, they reveal clusters of influence and opportunity that are hard to see in SQL joins.
"Who are the directors in my client base that link to Company X through more than one trust structure?"
That's one compact Cypher query — not a dozen brittle joins.
Typical Strengths
- Multi-hop traversals, shortest-path, community detection, centrality.
- Natural modelling of real-world entities and connections.
- Excellent for referral networks, co-ownership, beneficial ownership, and data lineage.
Typical Limits
- Not the best place for transactional ledgers.
- Complex OLAP may still live in your warehouse.
- Needs careful ID mapping back to the system of record.
Vector Databases: The Semantic Layer
Then there's the frontier technology — Vector Databases (Pinecone, Weaviate, Milvus, Qdrant). They don't store rows and columns. They store meaning. Text, research, transcripts — anything with semantic content becomes searchable by context, not by keywords.
Imagine asking:
"Show me all notes about energy-efficiency incentives under the UK's Smart Export Guarantee (SEG) scheme."
Even if no one wrote those exact words, the database understands the intent. That's the shift — from retrieval by syntax to retrieval by concept.
Typical Strengths
- Fast approximate nearest-neighbour (ANN) search over embeddings.
- Semantic recall of research, PDFs, emails, call notes, and policies.
- Foundational for Retrieval-Augmented Generation (RAG) with LLMs.
Typical Limits
- Needs a separate source of truth for IDs, entitlements, and constraints.
- Relevance can drift if embeddings are not refreshed.
- Requires guardrails to avoid hallucinated or stale context.
Hybrid Database Architecture
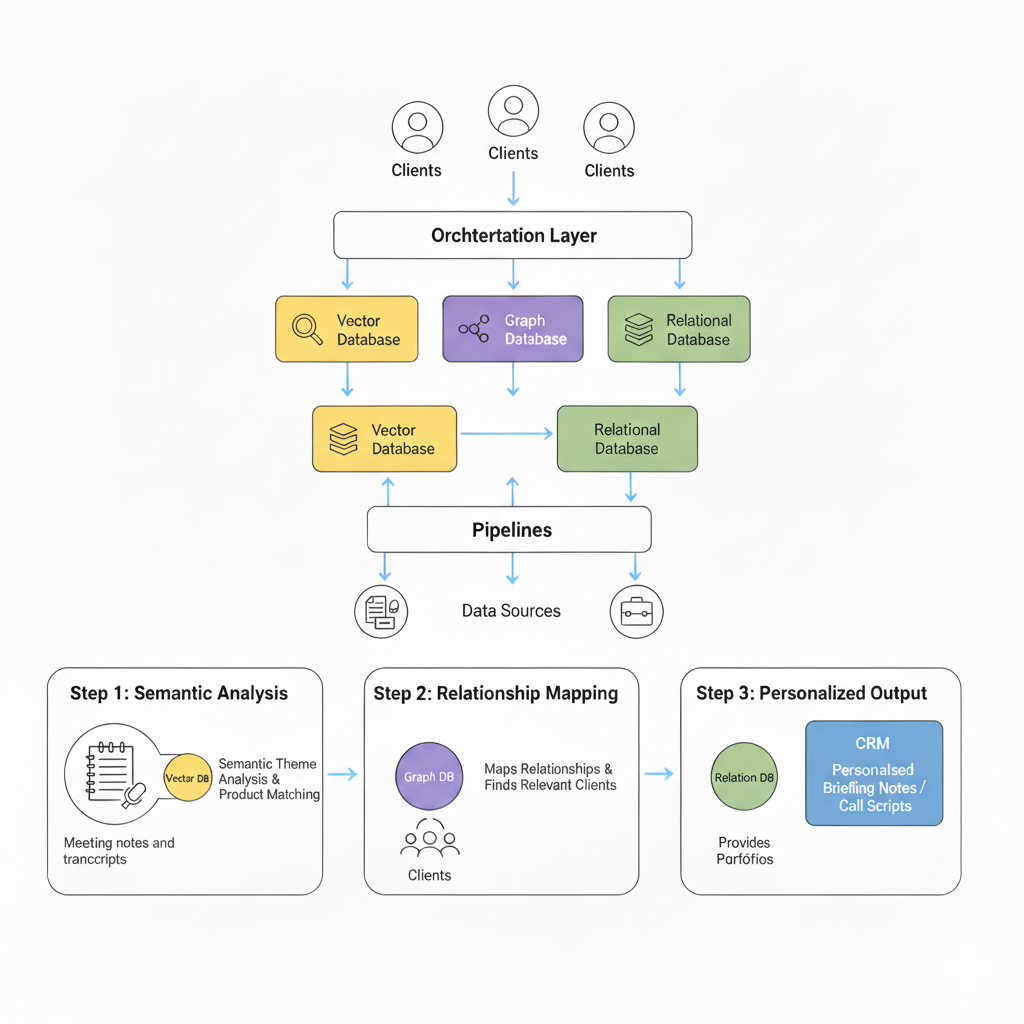
Figure 1: Hybrid architecture combining Relational, Graph, and Vector databases for wealth management use cases. Image produced by Google Gemini 2.5 Flash.
Example 1: Energy-Efficiency Opportunity (UK Context)
A London-based independent firm wants to identify which clients could benefit from UK energy-efficiency incentives — especially the Smart Export Guarantee (SEG) and relevant capital allowances for low-carbon investments.
Workflow
- Vector DB surfaces all research and commentary mentioning renewables, SEG, or energy-efficiency incentives — even when phrasing differs.
- Graph DB maps which clients are connected to companies, trusts, or properties linked to that sector.
- Relational DB verifies actual holdings, cash positions, timing constraints, and mandate restrictions.
Outcome
The adviser walks into a meeting with a tailored, evidence-backed narrative — not a static factsheet. The discussion is grounded in holdings, relationships, and current policy.
Example 2: The Meeting Notes Play
Now suppose every meeting note and client call transcript is embedded into a vector database.
- Vector DB (Step 1): AI analyses emerging client themes — inflation protection, ESG interest, income stability — and maps them to products (funds, SMAs) that align.
- Graph DB (Step 2): Determines which clients are relevant based on relationships (e.g., trustees, family groups, or connected entities).
- Relational DB (Step 3): Extracts each targeted client's current portfolio positions and constraints.
The orchestration layer then drafts:
- A personalised briefing note per client or client group.
- A compliant call script for the adviser.
- Relevant product collateral and disclosures.
This is surfaced directly in the CRM with a call to action. Not a data dump — an action plan.
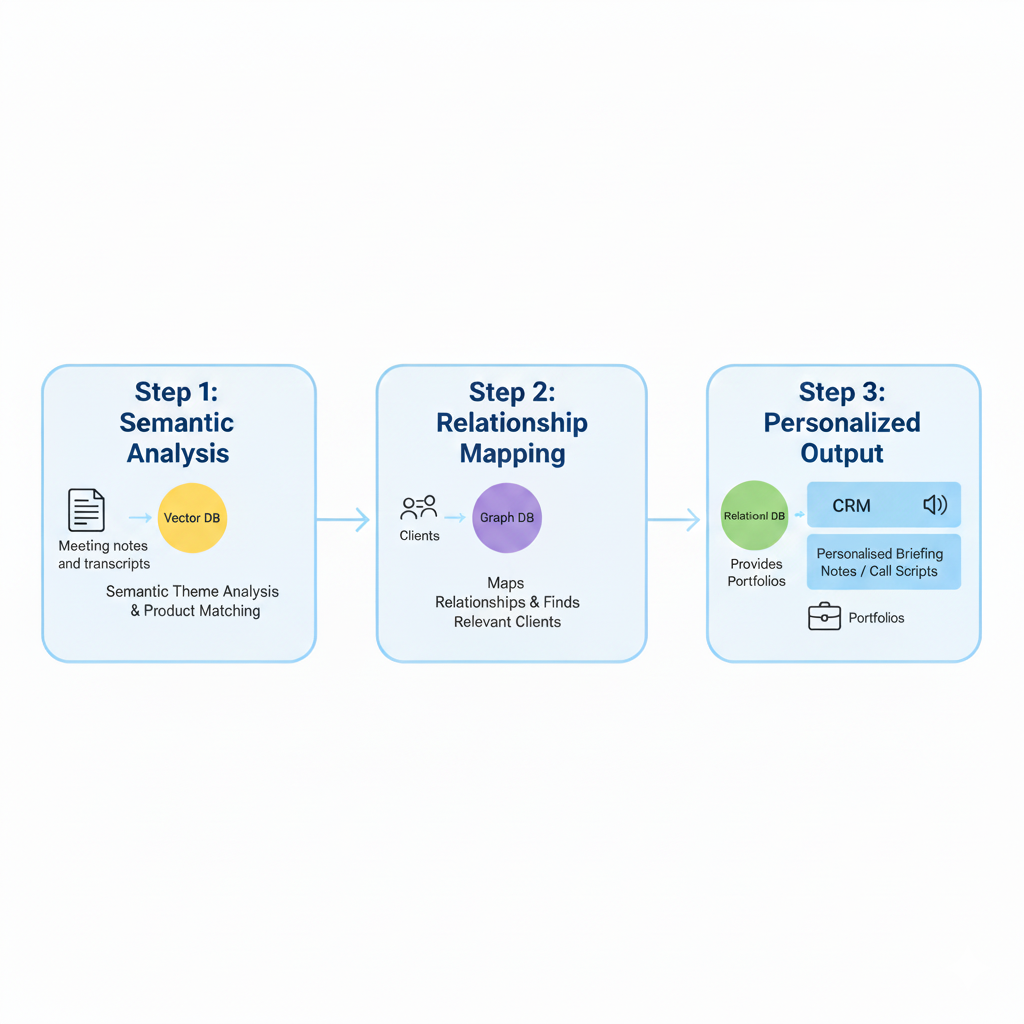
Figure 2: End-to-end workflow — meeting notes in Vector DB → client matching in Graph DB → portfolio validation in Relational DB → CRM action. Image produced by Google Gemini 2.5 Flash.
Phased Adoption: From Quick Wins to Full Orchestration
Firms don't need to deploy all three database types at once. A phased approach lowers cost, reduces integration risk, and builds capability step-by-step.
Phase 1 — Quick Wins (Vector + Relational)
- Embed research, adviser notes, and transcripts for instant semantic search.
- Keep IDs and entitlements in the relational core to ground the results.
- Deliver a search + briefing experience that already saves hours per week.
Phase 2 — Relationship Mapping (Add Graph DB)
- Overlay relationship data to map influence, exposure, and referral pathways.
- Use graph traversal to prioritise clients by relevance, proximity, or risk.
- Introduce explainability for RAG outputs via graph-based provenance.
Phase 3 — Full Orchestration
- Combine all three stores behind a reasoning service (LLM-assisted where appropriate).
- Push next-best-action recommendations into the CRM with audit trails.
- Add evaluation loops (win/loss, follow-up outcomes) to refine prompts and retrieval.
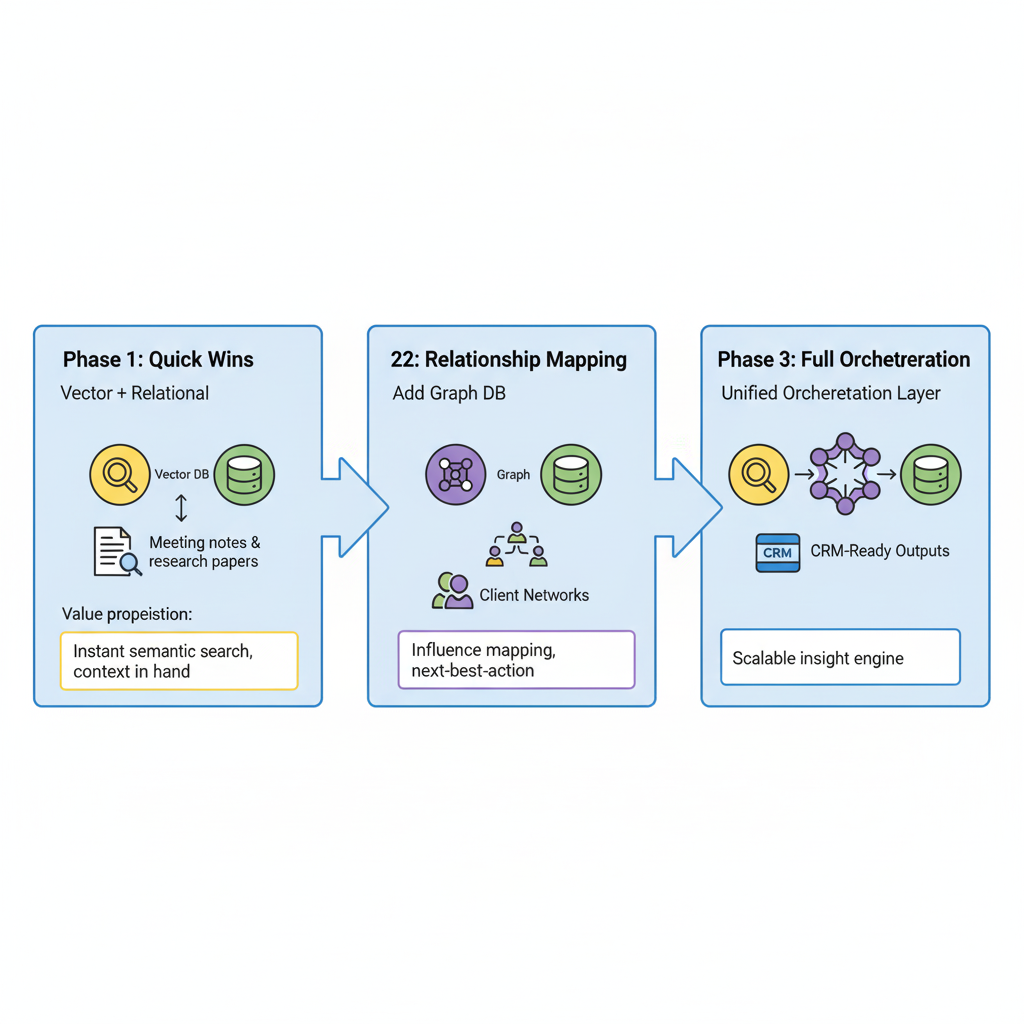
Figure 3: Evolution from quick wins to full orchestration using a hybrid data architecture. Image produced by Google Gemini 2.5 Flash.
Compliance and Governance Lens
A hybrid database setup doesn't just create insights — it strengthens governance.
- Vector DB: Enhances KYC/AML detection through semantic screening of communications and reports (e.g., suspicious patterns, sanction hits in narrative text).
- Graph DB: Improves auditability and AI explainability by tracing data lineage and influence paths; supports UBO analysis and conflict detection.
- Relational DB: Reinforces future-proofing with stable schemas, reference data, and reconciled ledgers — the anchor for regulatory audits and attestations.
Better compliance accelerates trust — with clients and with regulators.
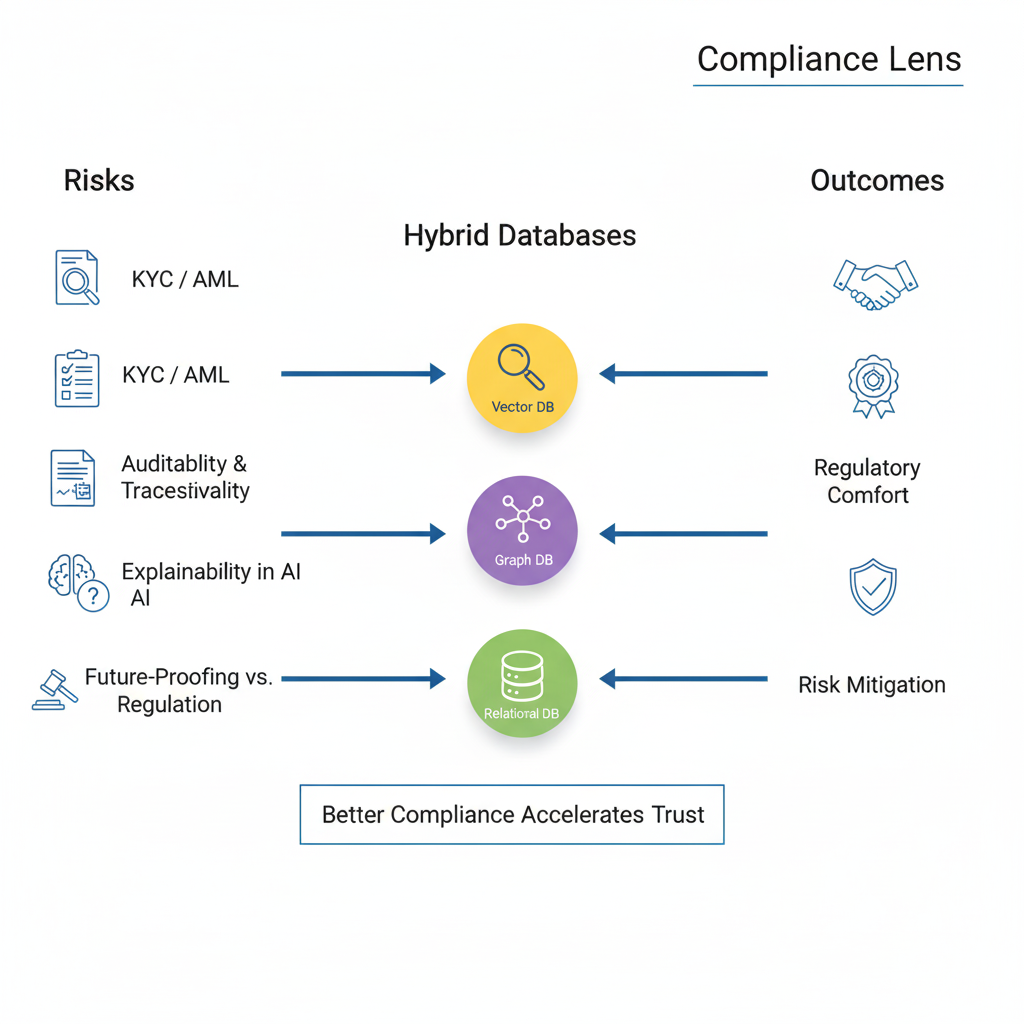
Figure 4: Compliance-driven use of hybrid databases in wealth management. Image produced by Google Gemini 2.5 Flash.
Example Queries
Relational (SQL)
SELECT client_id, asset_class, SUM(market_value) AS total_value
FROM portfolios
WHERE client_id = 1023
GROUP BY asset_class;
Graph (Cypher)
MATCH (c:Client)-[:BENEFICIARY_OF|DIRECTOR_OF|SHAREHOLDER_OF*1..3]-(co:Company {name: "Company X"})
RETURN DISTINCT c.name;
Vector (Python API)
index.query(
    vector=embedding("UK Smart Export Guarantee (SEG) incentives"),
    top_k=10,
    filter={"doc_type": "meeting_notes"}
)
Implementation Reality Check
This isn't plug-and-play. Hybrid architectures demand discipline.
- Data orchestration and schema alignment.
- ID consistency and ETL pipeline governance.
- Refresh strategies for embeddings.
- Security and role-based access.
- Continuous evaluation of insight-to-action outcomes.
Start small, validate, expand. Quick wins become cultural momentum.
Why It Matters for Independent Wealth Managers
Large institutions already run hybrid data stacks. Boutique firms can now match that analytical depth for under £10k/year with cloud-native tools — the real advantage is agility.
- Relational DB = truth
- Graph DB = context
- Vector DB = meaning
Together, they unlock institutional-grade intelligence without institutional drag.
Conclusion
The future of wealth management isn't about who holds more data. It's about who can turn that data into narrative — fast, relevant, and compliant.
Relational databases give you certainty.
Graph databases give you connection.
Vector databases give you comprehension.
Combine them — and you gain what every client values most: clarity in complexity.
About the Author
Terry Yodaiken is a financial services executive and AI specialist based in the UK. He leads data-driven transformation projects for independent wealth managers and institutional advisers through POVIEW.AI.
Ready to Build Your Hybrid Data Architecture?
POVIEW.AI helps wealth managers implement governed, scalable data architectures that deliver institutional-grade insights without institutional complexity.
Let's Discuss Your Data Strategy