Beyond the Data Warehouse: How Investment Managers Can Use Relational, Graph, and Vector Databases Together
From research overload to explainable investment decisions with a modern, hybrid data stack
Investment managers have never had more data. And they've never been under more pressure to explain exactly how they use it.
In one CIO roundtable last quarter, three different firms described exactly the same problem, just spread across different systems:
- Structured data in OMS, PMS, risk and performance systems
- Vast quantities of research, ESG reports, broker notes, and meeting minutes
- Complex client mandates, regulatory constraints, and internal risk appetites
Yet the core questions remain stubbornly hard:
- "What do we actually know about this issuer beyond the factsheet?"
- "Which clients are most exposed if this theme breaks down?"
- "Can we explain why this portfolio looks the way it does in a way a regulator will accept — and defend in an IC pack or FCA/PRA review?"
In a recent article for wealth managers, I described a hybrid data stack built from three database types: relational, graph, and vector. It delivers institutional-grade intelligence on a realistic budget.
You can read that playbook here:
https://poview.ai/blog/databases-wealth-managers-playbook
Investment managers can apply the same pattern. With some sector-specific twists.
Relational Databases: The Investment Book of Record
First, relational databases remain your ground truth:
- Positions, trades, and holdings across portfolios and funds
- Benchmarks, analytics, factor exposures, risk metrics
- Client and mandate data: limits, restrictions, ESG preferences, exclusions
- Performance, attribution, and fee calculations
This is where you keep the Investment Book of Record (IBOR) and Client Book of Record (CBOR) clean and auditable.
But relational DBs don't capture how your investment thesis evolved over time. They don't show the full network of relationships between issuers, sectors, funds, and clients. And they certainly don't capture the meaning inside thousands of PDFs and meeting notes.
For that, you need graphs and vectors.
Graph Databases: Mapping Exposure, Influence, and Risk
Graph databases let you model the investment universe and your portfolios as networks:
- Issuers ↔ sectors ↔ themes (e.g. "energy transition", "AI infrastructure")
- Issuers ↔ funds ↔ clients
- Issuers ↔ controversies ↔ ESG flags
- Analysts ↔ coverage lists ↔ notes
You can then ask questions like:
- "Which clients are indirectly exposed to this downgrade through multi-asset funds?"
- "Which funds are most reliant on a small set of highly connected issuers?"
- "Where do specific ESG controversies cluster in our portfolios?"
You can also model idea propagation:
- Which analysts or PMs originate ideas that spread widely?
- Which internal research is consistently associated with positive excess return?
This graph layer is the relationship lens your data warehouse never quite delivered.
Vector Databases: Making Research and Notes Fully Searchable
Now add vector search over:
- Internal research reports and models
- Broker and third-party research
- ESG and stewardship reports
- Company transcripts, management meetings, and notes
Instead of keyword search for "AI", you can search for concepts, including ones you'd struggle to capture with simple tags:
- "Capital-light compounding businesses with recurring B2B revenue"
- "Companies with credible scope 1–3 emissions reduction plans, not just targets"
- "Management teams with a track record of disciplined capital allocation"
You can also run RAG (Retrieval-Augmented Generation) safely:
- Generate draft investment summaries grounded only in your own research corpus
- Provide PMs with briefing packs before IC meetings, based on the latest internal work
- Support sales with client-ready narratives derived from both holdings and research, with full traceability back to sources
"Show me EM utilities with credible scope 1–3 decarbonisation plans that behaved like our best 2016–2019 compounders."
That's the sort of query a vector-backed research stack can actually serve.
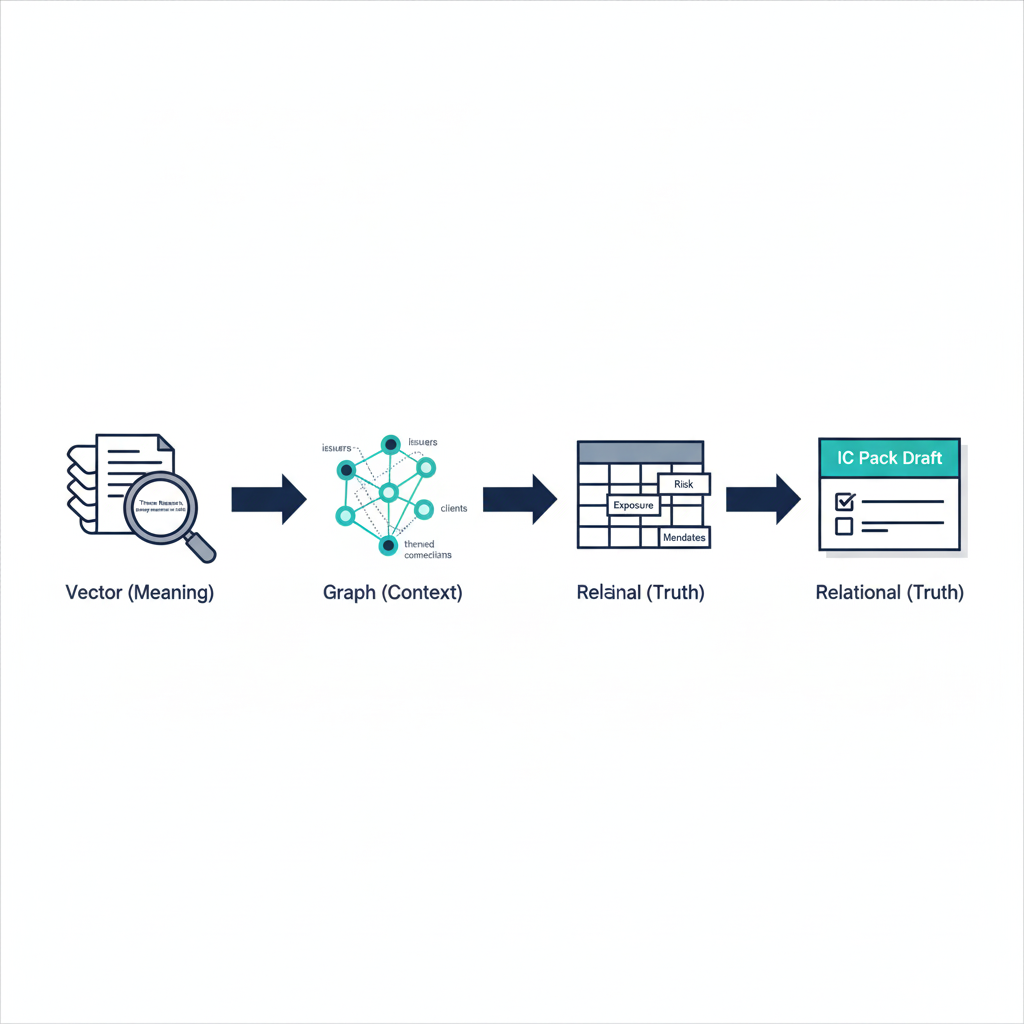
Use Case 1: Faster, Explainable Thematic Investing
Vector DB indexes all internal and external research tagged to a theme (e.g. "energy transition in EM").
Graph DB maps issuers, securities, and funds linked to this theme.
Relational DB confirms actual exposures, risk limits, and client mandates.
Now an analyst can:
- Identify credible new candidates that fit the thematic pattern but aren't yet widely held
- See which clients and funds are already exposed and at what concentration
- Generate IC material that clearly traces recommendations back to underlying research
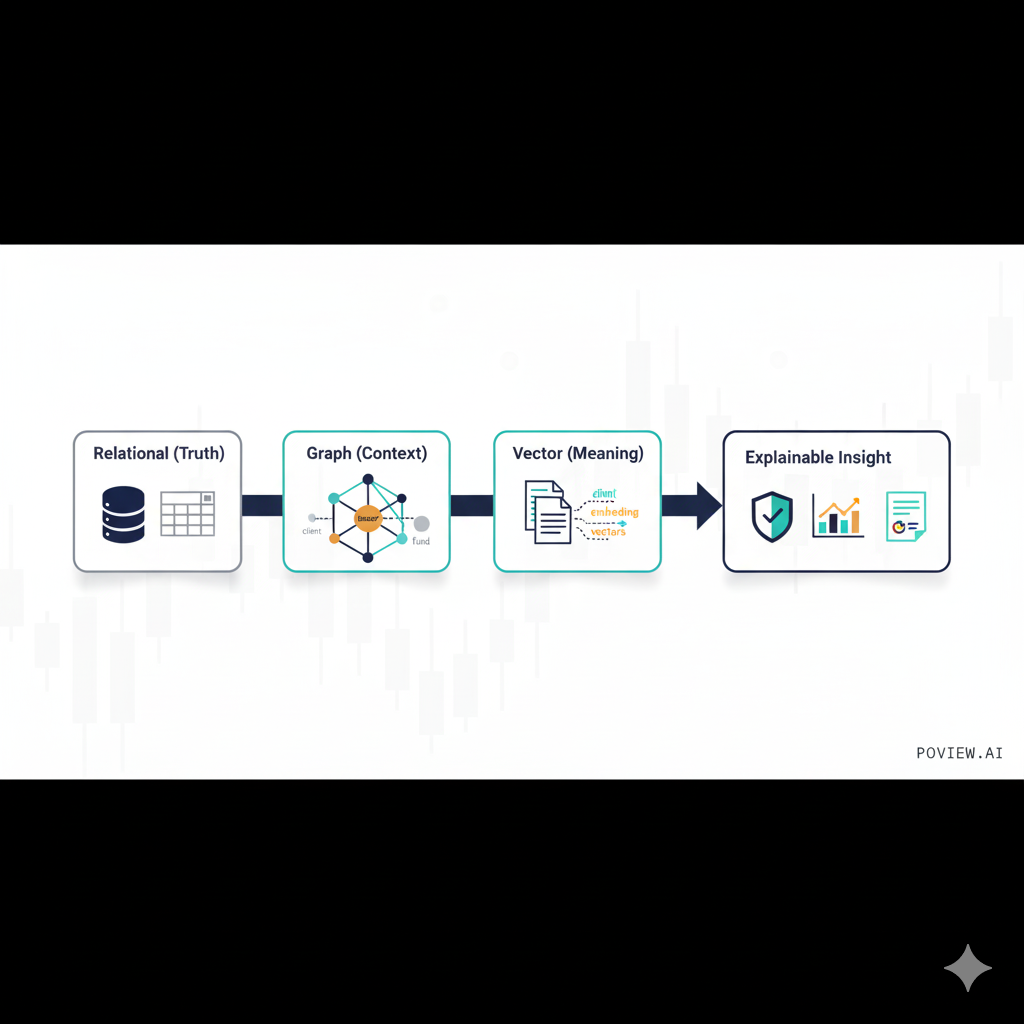
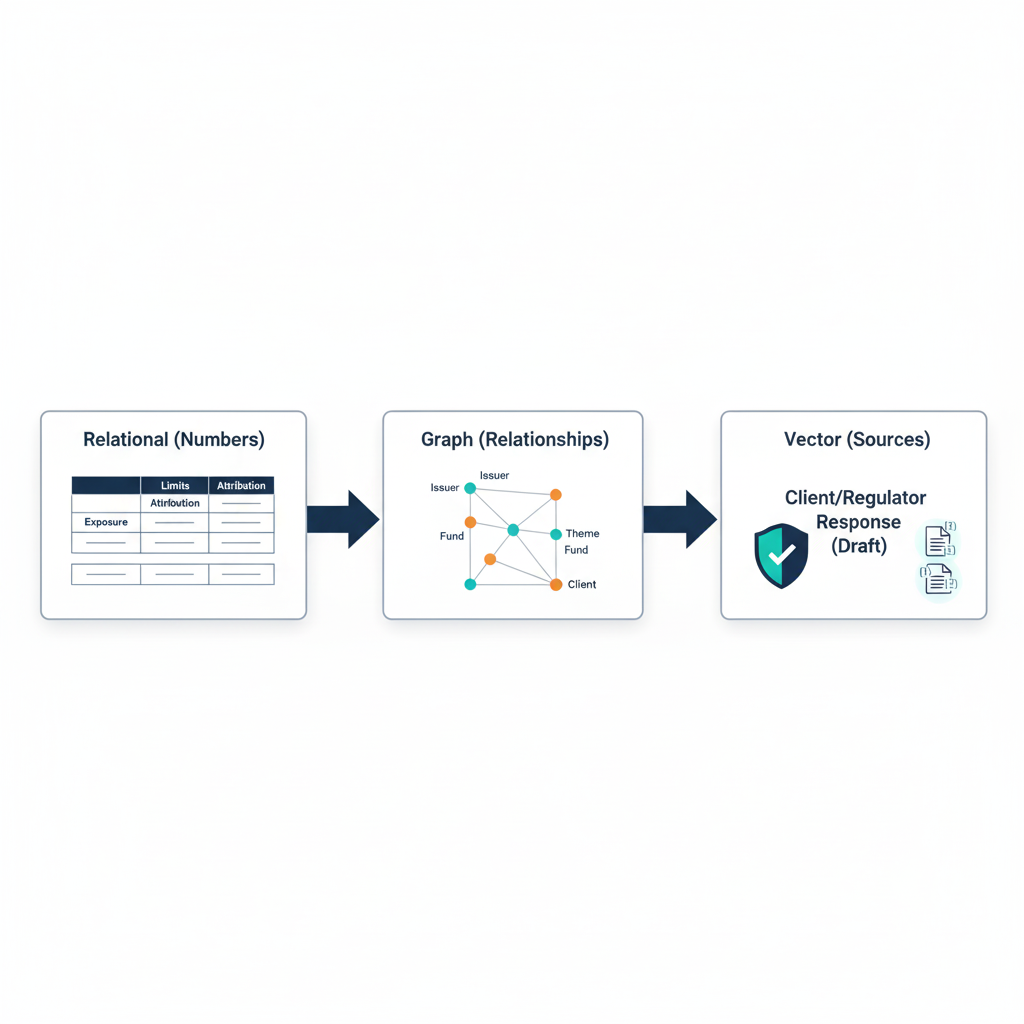
Use Case 2: Client and Regulator-Ready Explanations
When a client or regulator asks:
"Why does this portfolio look like this, and how did you consider risk and ESG factors?"
You can answer with:
- Relational DB: Hard numbers. Exposures, limits, risk and attribution.
- Graph DB: Relationship views. How issuers, controversies, and themes connect.
- Vector DB: The actual research evidence and meeting notes that informed decisions.
An AI assistant on top of this stack can generate draft explanations that are data-grounded, fully traceable back to underlying evidence, and structured in language clients and regulators understand.
This isn't replacing the investment process. It's making it legible and scalable — so the story matches the numbers.
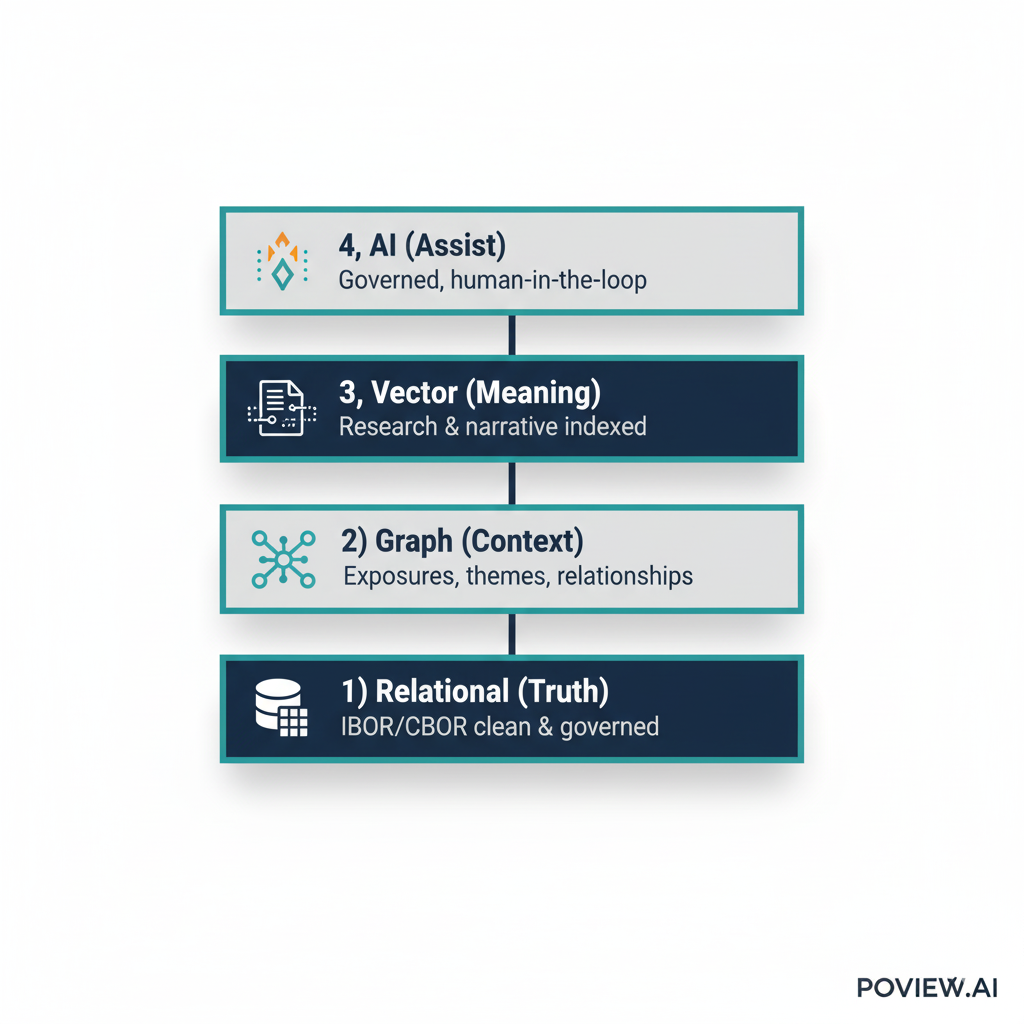
Start with the Architecture, Not the Tool of the Week
Most "AI for investment management" pitches jump straight to models.
The more robust approach is to start with the architecture and let AI sit on top of it, not underneath it.
- Get the relational core (IBOR/CBOR) clean and authoritative.
Reconciled, governed, boring in the best possible way. - Add a graph layer to understand relationships: exposures, themes, clients, people.
So you can see how risk and ideas propagate, not just where they land. - Index your research and narrative content in a vector store
(start with the last 12–18 months to avoid polluting results with stale context). - Only then add AI services on top, with governance, monitoring, and human-in-the-loop.
Assistants that draft, not decide; humans who sign off, not rubber-stamp.
That's the approach I lay out in detail in the original wealth management article:
https://poview.ai/blog/databases-wealth-managers-playbook
At POVIEW.AI, we help investment managers implement these hybrid data architectures in weeks, not years. Using cloud-native components and managed services, you don't need a multi-year transformation to get started — you need a clear target architecture and a focused first use case.
The outcome is simple:
- Better decisions
- Clearer explanations
- More scalable client engagement
All built on a data stack that regulators can understand and your teams can actually use.
Ready to Transform Your Data Architecture?
Let's discuss how a hybrid data stack can work for your investment management firm.